
BLDC motor efficiency: where the losses go
Quick Answer
At rated load, a typical BLDC motor may convert 85–95% of terminal input into shaft output with a cold winding. Including the controller puts system efficiency around 80–91%. Those figures do not describe every application. Peak efficiency often occurs at 70–85% of rated torque. A winding at 120 °C can reduce efficiency by about 2 percentage points, and quarter-load operation may reduce it by another 7. Any quoted figure should include the measurement boundary, load point, and winding temperature.
- What efficiency measures
- Typical efficiency ranges
- Three measurement boundaries
- A sample loss budget
- Efficiency across the load range
- How temperature affects efficiency
- How efficiency is measured
- IE classes and BLDC motors
- Reading an efficiency datasheet
- Six common specification errors
- Where efficiency gains come from
- Matching efficiency to the duty cycle
- Greensky Power engineering information
- References
- FAQ
What efficiency measures
Efficiency is a ratio, and a ratio is only as meaningful as its two terms:
η = P_out / P_in = P_mech / P_elec
The numerator is mechanical power at the shaft, P = T × ω. The denominator is electrical input power, and this is where specifications diverge. If P_in is measured at the motor terminals, the result is a motor-only efficiency and the controller is outside the fence. If P_in is measured at the DC bus, the result is a system efficiency and the controller’s own losses are inside it. The same hardware can legitimately be described as 88% or 84.9% depending on which fence you draw, which is why two datasheets can disagree by four points without either being wrong.
Output power may be measured directly with a dynamometer or inferred by subtracting modelled losses from measured input. The first method measures output; the second calculates it. A supplier’s 92% figure is difficult to assess without its test standard and method. IEC 60034-2-1 distinguishes direct input-output testing from summation-of-losses methods, which have different uncertainties [1].
Efficiency changes with operating point. The way the stator field is switched and the shape of back-EMF are explained in how a brushless DC motor works. A 400 W motor rated at 88% efficiency at 3,000 rpm and rated torque will have different efficiency at other speed and torque combinations. A single figure represents one point on a two-dimensional efficiency map.
Typical efficiency ranges
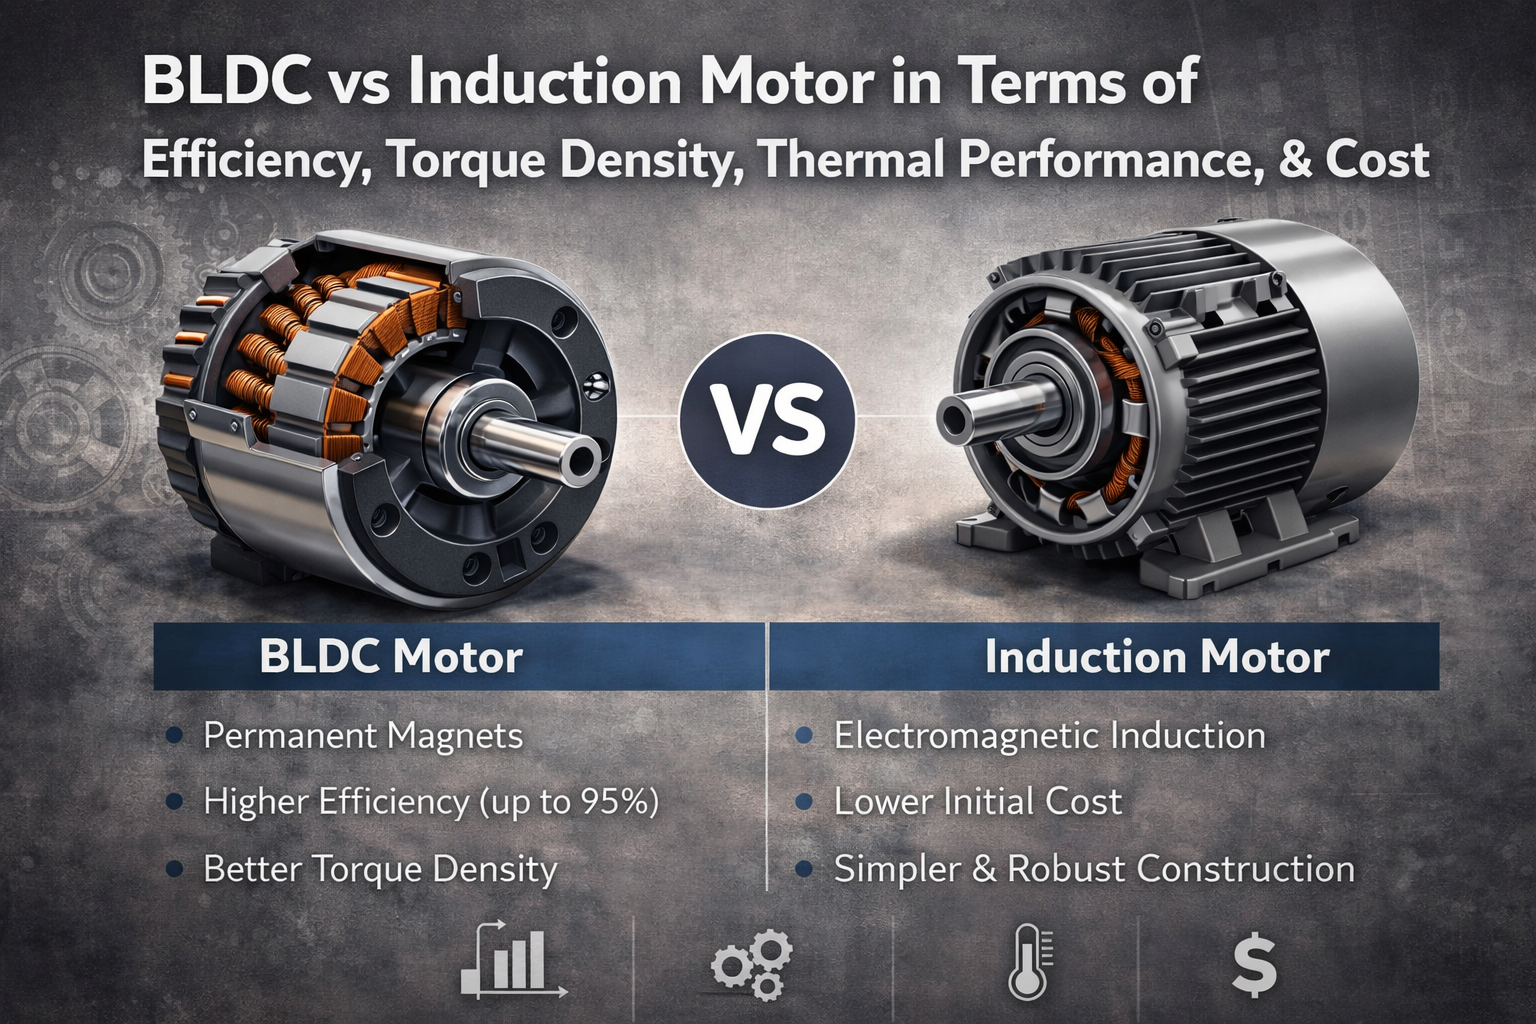
The ranges in the table are typical for well-designed surface permanent-magnet motors at rated load. They assume terminal-to-shaft measurement, a winding near ambient temperature, a smoothed supply, and a controller outside the measurement boundary.
| Shaft power band | Typical motor-only efficiency | What usually limits it |
|---|---|---|
| Under 100 W | 70–85% | Bearing friction and windage are a large share of a small power budget; end-winding copper is proportionally heavy |
| 100 W to 1 kW | 80–90% | Copper loss dominates; lamination grade and slot fill set the ceiling |
| 1 kW to 10 kW | 85–93% | Balance between copper and iron loss; magnet grade and air-gap tolerance matter |
| Above 10 kW | 90–95% | Stray and AC copper loss, cooling path, and manufacturing tolerance |
These ranges need test conditions before they can be compared. Electric motor basics explains the terminology. A 90% figure may come from a test with a stabilised DC supply, a 25 °C winding, one speed, no controller, and no load coupling. With a 40 kHz inverter, a winding at 110 °C, or operation at 30% rated torque, the result can be different. Use the ranges to check whether a proposal is plausible, not to rank two motors.
Three measurement boundaries
Efficiency comparisons often use different measurement boundaries. The table lists three useful boundaries and one combination that cannot be verified.
| Boundary | Input measured at | Output measured at | Typical value |
|---|---|---|---|
| Motor only | Motor terminals (three phase) | Shaft | 85–95% |
| Controller only (CDM) | DC bus | Motor terminals | 95–98% |
| System (PDS) | DC bus | Shaft | 80–91% |
| “Motor plus controller, best of each” | Mixes two boundaries and cannot be verified | Do not accept |
The relationship is multiplicative, not additive:
η_system = η_motor × η_controller
An 88% motor paired with a 96.5% controller delivers 84.9% efficiency from the DC bus to the shaft. The 3.1-point difference comes from including controller losses. In this example, a 2-point motor gain and a 1-point controller gain have similar effects on system efficiency, while upgrading the controller may cost less.
IEC 61800-9-2 distinguishes IE classes for complete drive modules from IES classes for power drive systems. System classification depends on the drive architecture, speed-torque profile, and time at each operating point [6]. The variable-speed motor class is covered separately by IEC TS 60034-30-2 [5]. Motor and controller losses should therefore be considered together. When sizing a 48 V brushless controller, calculate each loss separately, then multiply the component efficiencies.
A sample loss budget
Take a concrete machine: 48 V nominal, 400 W continuous at 3,000 rpm, surface permanent magnets. Rated torque follows from the power:
T = P / ω = 400 / (3000 × 2π / 60) = 400 / 314.16 = 1.273 N·m
At 88.0% motor efficiency, terminal input is 400 / 0.88 = 454.5 W, leaving 54.5 W of total loss. Breaking the loss into components helps with motor selection because each component changes differently with load, speed, or temperature.
| Loss component | Power (W) | Share of total loss | Scales approximately with |
|---|---|---|---|
| Stator copper (I²R) | 24.5 | 45% | Current squared, therefore torque squared |
| Stator iron (hysteresis + eddy) | 16.4 | 30% | Frequency for hysteresis, frequency squared for eddy |
| Bearing friction + windage | 6.5 | 12% | Speed, with windage rising near the cube |
| Stray load loss | 7.1 | 13% | Current squared |
| Total motor loss | 54.5 | 100% | — |
The loss breakdown shows how different components respond to operating conditions.
Copper loss depends on load. In the constant-flux region it rises with current squared, and current roughly follows torque. Halving torque therefore reduces copper loss to about one quarter. The same relationship applies to brushed DC machines, so a component-level loss budget is useful when comparing the two motor types.
Iron loss depends mainly on speed and magnetic frequency. At a fixed speed it changes little with load, so it can make up a larger share of total loss at light load. Eddy-current loss rises with frequency squared. A motor designed for 1,500 rpm may therefore lose efficiency at 6,000 rpm, even if the winding copper is unchanged.
Rotor-magnet loss also contributes. Rare-earth magnets conduct electricity, so spatial and temporal harmonics in the stator magnetomotive force can induce eddy currents in them. Ishak, Zhu and Howe report that this loss can matter with fractional slot-pole combinations, high electric loading, high speed, or many poles. They also found differences between brushless AC and brushless DC operation of the same rotor [9]. Tests using different commutation modes are not directly comparable unless torque and speed are held constant.
Our guide to how brushless motors are driven compares six-step, sinusoidal, and field-oriented control. At 96.5% efficiency, the controller dissipates 454.5 / 0.965 − 454.5 = 16.5 W. Total system loss is 71.0 W, DC-bus input is 471.0 W, and system efficiency is 84.9%. In this example, controller loss exceeds iron loss and is the second-largest loss.
Efficiency across the load range
Keep speed at 3,000 rpm and change the torque. Copper and stray losses fall approximately with load squared, while iron and most mechanical losses stay nearly fixed. The resulting estimates are:
| Load (% rated torque) | Shaft power (W) | Total motor loss (W) | Motor efficiency | System efficiency (× 0.965) |
|---|---|---|---|---|
| 25% | 100 | 24.2 | 80.5% | 77.7% |
| 50% | 200 | 30.3 | 86.8% | 83.8% |
| 75% | 300 | 40.5 | 88.1% | 85.0% |
| 100% | 400 | 54.5 | 88.0% | 84.9% |
In this example, efficiency peaks near 75% load rather than at rated torque. A similar pattern can occur in surface-magnet motors as the magnetic circuit approaches saturation and copper loss grows faster than output. At 25% torque, efficiency is 7.5 percentage points below the rated-load figure.
At quarter load, iron loss is 16.4 / 24.2 = 68% of total loss in this example. A better winding or magnet grade will not address that dominant loss. A smaller motor operating closer to its design point may use less energy when the duty cycle stays below half load.
IEC TS 60034-30-2 notes that a very high-efficiency motor may not save energy in intermittent, short-time, or part-load service. Efficiency class selection should reflect the actual load-speed points and time spent at each [5]. IEC 60034-2-3:2024 specifies seven standardised load points and an interpolation procedure for converter-fed AC motors [2].
How temperature affects efficiency
At a 20 °C reference, copper resistance rises by about 0.393% per kelvin. Across the range from 20 °C to 120 °C, that changes resistance by a factor of 1 + 0.00393 × 100 = 1.393, or about 39%. The increase affects the resistive part of the loss.
| Winding temperature | Resistance ratio (R / R₂₀) | Copper loss (W) | Motor efficiency |
|---|---|---|---|
| 20 °C | 1.000 | 24.5 | 88.0% |
| 60 °C | 1.157 | 28.3 | 87.3% |
| 100 °C | 1.314 | 32.2 | 86.5% |
| 120 °C | 1.393 | 34.1 | 86.2% |
The copper-resistance change alone reduces efficiency by about 1.8 percentage points in this example. Magnet temperature also matters. For sintered NdFeB, the reversible remanence coefficient is typically −0.11% to −0.13% per kelvin, depending on grade. A 100 K rise therefore reduces flux by roughly 11–13%. Maintaining the same torque would require 11–13% more current, increasing copper loss on top of the resistance change:
24.5 × 1.393 × 1.12² = 42.8 W
Using that copper loss, holding iron loss constant, and scaling stray loss with current squared gives about 74.6 W of total loss and 84.3% efficiency, 3.7 points below the cold figure. Two motors with the same cold efficiency can differ by more than a point at operating temperature because magnet grade, cooling path, and current density also affect performance. These details may not appear in a datasheet summary.
Cooling affects both reliability and operating efficiency. The temperature sensitivity of magnets also distinguishes permanent magnet and induction machines, since an induction rotor has no permanent-magnet remanence. A better thermal path can lower steady-state winding temperature and improve efficiency. For continuous-duty applications, request efficiency at thermal steady state. See electric motor testing standards for reference-temperature information.
How efficiency is measured
IEC 60034-2-1 offers several routes to the same ratio, with different uncertainty:
- Direct input-output. Measure electrical input and mechanical output simultaneously with a dynamometer. Simple, and limited by the torque transducer and power analyser.
- Summation of losses. Measure each loss component separately, including stator I²R corrected to a reference temperature, core loss from a no-load voltage sweep, friction and windage estimated by extrapolation, and stray load loss from the residual. Subtract their sum from measured input. This takes more work and has lower uncertainty; the source identifies it as the preferred route for machines above roughly 1 kW [1].
- Assigned stray loss. Take stray load loss from a table instead of measuring it. Fast, and the weakest of the three.
The stated instrument accuracy is about 0.2% for electrical quantities, 0.2% of full scale for torque, and 0.1% for speed. At 95% efficiency, losses are 5% of input, so a 0.2% input error equals 4% of the loss. The resulting efficiency uncertainty can reach a few tenths of a point. Proving higher efficiency therefore requires more precise tests, such as back-to-back or calorimetric methods.
The treatment of stray loss can change the result. Using an assigned table value instead of measuring residual stray loss can shift reported efficiency by 0.5 to 1.5 percentage points, potentially moving a motor across a regulatory class boundary. Suppliers may therefore report different values for similar motors if they use different methods.
Converter-fed machines need a different test
BLDC motors are supplied through a converter, so IEC 60034-2-1 alone does not cover the full test context. IEC 60034-2-3:2024 specifies testing of converter-fed AC motors at seven standardised load points, with interpolation across the constant-torque, field-weakening, and overload ranges [2]. The procedure accounts for efficiency changing across the operating map; a single value describes only one test point.
Test supply can affect the result as well as load. Ragazzo and co-authors report that efficiency maps based on an ideal sinusoidal supply can differ from maps measured under PWM inverter supply, where current ripple adds copper, iron, and magnet losses [10]. A datasheet should state switching frequency and DC-bus voltage so readers can judge how closely the test matches their application. Loss models that separate hysteresis, eddy-current, and magnet losses can help estimate the difference without a full efficiency-map test [11].
IE classes and BLDC motors
A trapezoidally commutated BLDC motor does not have a formal IE3 or IE4 class under these standards. A brushless datasheet using “IE4 equivalent” is making an informal comparison. The distinction follows from the standards’ scope:
IEC 60034-30-1 applies to single-speed machines rated for direct-on-line sinusoidal operation, from 0.12 kW to 1,000 kW, above 50 V and up to 1 kV, with 2, 4, 6 or 8 poles. The 2014 edition explicitly excludes motors with mechanical commutators, multi-speed motors, and motors that cannot be tested separately from the driven machine [3]; the second edition, published in 2025, retains the line-operated basis of the series title [4].
A BLDC motor falls outside the line-operated standard because it is driven through electronic commutation rather than connected directly to the sinusoidal mains. IEC TS 60034-30-2 separately covers converter-fed machines designed for sinusoidal fundamental current and not for direct grid operation. Its examples include permanent-magnet synchronous machines with or without reluctance torque [5].
A trapezoidally commutated BLDC does not fit neatly into either category because it is neither line-operated nor designed for sinusoidal fundamental current. A permanent-magnet motor driven with sinusoidal field-oriented control may fit the technical specification. Since both designs may be called “BLDC,” state the commutation mode in the specification.
| Question you are actually asking | Document | What it covers |
|---|---|---|
| How is efficiency measured? | IEC 60034-2-1 | Loss and efficiency determination, sinusoidal supply |
| How is a converter-fed motor measured? | IEC 60034-2-3 | Seven load points plus interpolation across torque and speed |
| Can I put an IE class on it? | IEC 60034-30-1 | Line-operated single-speed machines only |
| Can I class a variable-speed machine? | IEC TS 60034-30-2 | Sinusoidal-fundamental, converter-fed machines |
| How efficient is the drive system? | IEC 61800-9-2 | CDM (IE) and PDS (IES) efficiency classes |

Request measured efficiency at specified torque and speed, with DC-bus voltage, switching frequency, winding temperature, test method, and controller efficiency listed. These details are more useful than an informal class label. Our efficiency class guide explains how IE classes are defined.
Reading an efficiency datasheet
Use these eight questions to evaluate an efficiency claim:
| # | Ask for | Why it changes the number |
|---|---|---|
| 1 | Load point: torque and speed | Peak efficiency typically sits at 70–85% of rated torque, not at rated |
| 2 | Boundary: terminals or DC bus | Controller loss alone accounts for 2–5 points |
| 3 | Winding temperature at test | 20 °C to 120 °C is worth roughly 2 points on copper alone |
| 4 | Test standard and method | Assigned versus measured stray loss can differ by up to 1.5 points |
| 5 | Supply: DC-bus voltage, switching frequency | PWM ripple adds loss that a sinusoidal model does not predict |
| 6 | Cooling condition and ambient | Sets the steady-state winding temperature, hence the real efficiency |
| 7 | Whether the number is measured or modelled | Inferred output is a calculation, not a measurement |
| 8 | Efficiency at the median load of your duty cycle | The rated-point figure may never occur in your application |
Few datasheets answer all eight. Without the measurement boundary and winding temperature, the figure cannot be compared reliably. Without supply details, it may not represent the intended application.
Six common specification errors
1. Comparing a motor-only figure with a system figure
This is a common error in tender comparisons. A 92% motor-only claim and an 89% system claim include different losses, so the motors or systems may perform similarly. Convert both figures to the same DC-bus-to-shaft boundary before comparing.
2. Sizing at peak load and running at a quarter of it
A 400 W motor supplying 100 W continuously operates at 25% load. In the example above, its efficiency is 80.5%, compared with 86.8% for a 200 W motor at half load. The larger motor also costs and weighs more, and runs cooler than its intended design point.
3. Quoting a cold number for a hot application
A measurement with the winding at 25 °C may not represent continuous operation. In a sealed enclosure at 40 °C ambient, the winding can stabilise at a higher temperature, changing the operating efficiency.
4. Forgetting that the controller is in the loss budget
A 96.5% controller on a 400 W motor dissipates 16.5 W, more than the iron loss in this example. At higher power, controller loss rises with current. At low DC-bus voltage, MOSFET conduction loss rises with current squared. Both effects matter.
5. Assuming higher efficiency always pays back
The payback depends on energy use. At 400 W output and 2,000 operating hours per year, a one-point improvement saves about 10.5 kWh at the rated point. If the motor spends most of its time at quarter load, that rated-point saving may not occur. Estimate payback from the duty cycle rather than the class label.
6. Optimising the wrong operating point
A motor designed for peak efficiency at rated torque may perform worse than a lower-cost model at 30% torque. More copper and higher flux density can raise part-load iron loss. Specify performance at the weighted operating point, not only at peak efficiency.
Where efficiency gains come from
The list is ordered roughly by return on effort for a permanent-magnet brushless motor:
- Right-sizing. Moving the operating point toward 70–85% of rated torque is worth several points and costs nothing but discipline.
- Speed control instead of throttling. For fans and pumps the gain dwarfs everything on this list — see the next section.
- Control strategy. Field-oriented control with proper current-angle selection reduces copper loss per unit torque against six-step commutation, at the cost of slightly higher switching loss; the net gain depends on where in the speed range you operate.
- Lamination grade and thickness. Thinner, higher-resistivity steel attacks the eddy component of iron loss, which is the term that grows fastest with speed. This is where high-speed designs win or lose.
- Magnet grade, segmentation and pole-slot combination. Segmentation and a better slot-pole choice cut magnet eddy loss, which also protects against irreversible demagnetisation at high temperature [9].
- Winding design. Higher slot fill and shorter end windings reduce DC copper loss; stranded or litz conductors reduce AC copper loss where the PWM ripple is significant.
- Bearings and windage. Small at low speed, dominant in small high-speed machines. Ceramic bearings and rotor surface finish are the usual levers.
System-level choices often have a larger effect than material upgrades. Efficiency is one factor in a brushless design; the known drawbacks of brushless motors also belong in the evaluation. Material changes can add efficiency, often by the last few points, but their effect depends on the operating point. They are also easy to feature in marketing, which is why proposals may lead with magnet grade. Ask for the expected duty and operating point as well.
Matching efficiency to the duty cycle
Annual energy use depends on both efficiency and operating hours. The table links common application patterns to their main loss mechanisms and the factors worth optimising.
| Application pattern | Where time is spent | Dominant loss | What to optimise |
|---|---|---|---|
| E-bike and light EV traction | Wide speed range, 20–60% torque most of the time | Copper at low speed, iron at high speed | Efficiency across the map, not at one point |
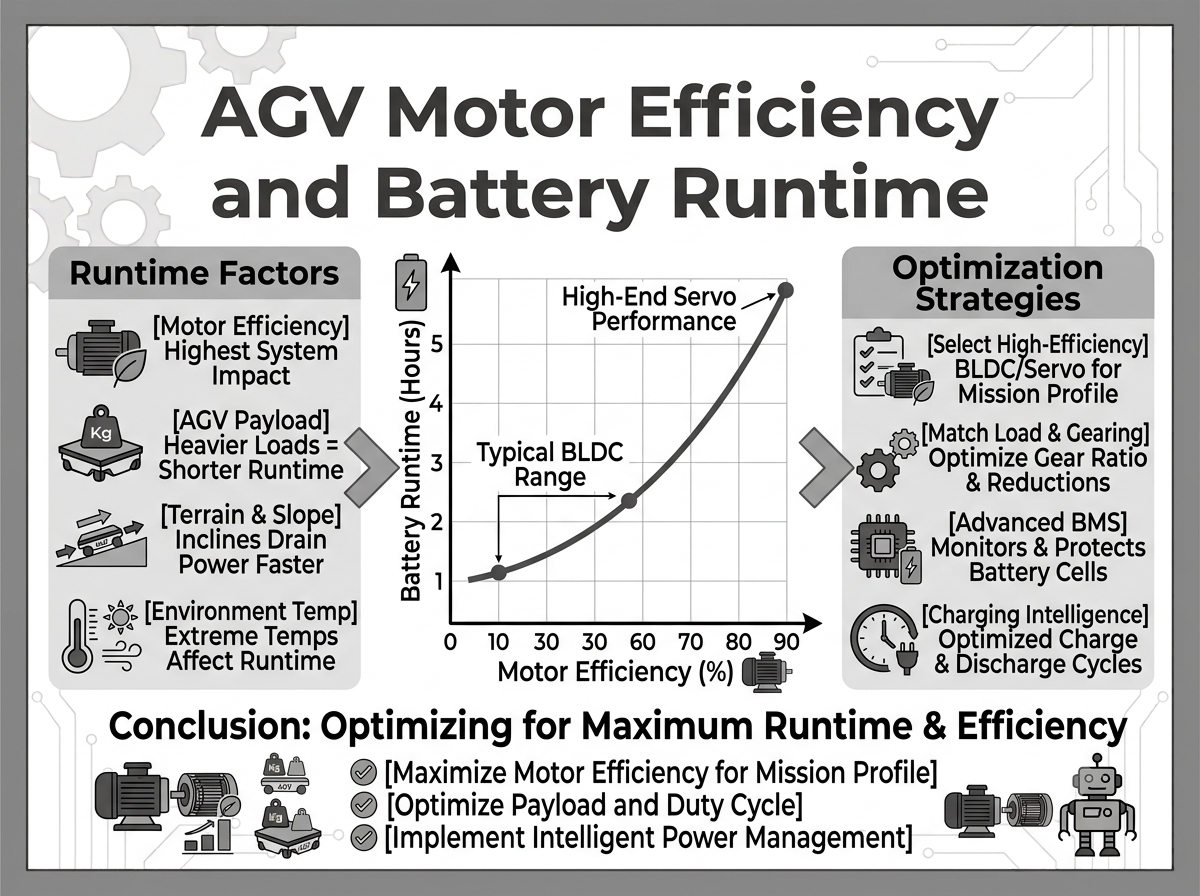
| AGV and warehouse robotics (48 V AGV drives) | Continuous low speed, high torque, frequent starts | Copper, plus controller conduction loss | Low-speed torque per amp; controller on-resistance |
| Industrial fan | Long hours, throttled by damper | System, not motor | Variable speed — see below |
| Centrifugal pump (pump duty) | Long hours near rated | Copper and iron, balanced | Rated-point efficiency plus a part-load check |
| Power tool | Seconds per minute, thermally limited | None of the above | Peak torque per gram; efficiency is nearly irrelevant |
| Drone and UAV | High speed, low torque, mass critical | Iron and windage | Loss at high electrical frequency; mass per watt |
Fans and pumps can offer large system-level savings through speed control, independent of a small improvement in motor efficiency.
For a centrifugal load, shaft power varies with the cube of speed. This is why variable-speed operation and the difference between a VFD-driven motor and a fixed-speed motor can matter more than a one-point nameplate improvement. Reducing speed by 20% cuts power to 0.8³ = 0.512, a 48.8% reduction under the affinity-law assumptions. Matching that reduction through motor efficiency alone would require a change from 88% to 172%, which is impossible. IEC 61800-9-2 therefore evaluates the motor, controller, and duty profile as a power drive system [6]. For a fan or throttled centrifugal pump with long operating hours, begin industrial fan motor and pump motor selection with the speed profile.
Traction motors should be compared using efficiency weighted across the drive cycle. Our BLDC and brushed DC drives for electric vehicles comparison models this trade-off using total cost. The case for brushless traction also considers cycle-weighted efficiency. For an overview of traction motor types, see the types of electric vehicle motors.
Greensky Power engineering information
Efficiency figures are easier to assess when the test conditions and system boundary are stated. For brushless DC motors, our engineering practice includes:
- Efficiency quoted with its boundary and load point. We state whether a figure is motor-only or system-level, and at which torque and speed it was taken. When a customer needs the full surface, we supply multi-point data rather than a single coordinate.
- Loss budget available on request. Copper, iron, mechanical and stray loss split for the specified operating point, so the dominant term is visible before the design is frozen.
- Thermal steady-state figures. Continuous-duty ratings are quoted at the stabilised winding temperature, not at ambient, because that is the number the application will experience.
- Controller loss treated as part of the system. Motor and matched brushless controller are specified as a pair, with the combined bus-to-shaft efficiency stated.
- Geared and integrated variants. Where the load needs torque rather than speed, a BLDC planetary gear motor keeps the motor near its efficient operating point instead of running it far down the speed range, which is often worth more than a material upgrade.
- Design for the duty cycle. We size against the weighted operating point for traction, AGV, fan, and pump duties. If a smaller frame is the better fit, we will say so. See our high-efficiency 36 V range and industrial brushless range.
When comparing proposals, use the torque calculation method to establish the operating point if a supplier omits it. Our selection framework covers the remaining specifications. For custom winding, shaft, or mounting requirements, see custom brushless DC motor engineering or the custom motor programme. Our manufacturing capability describes the tooling and qualification path for volume programmes.
References
- IEC. (2014). IEC 60034-2-1:2014 — Rotating electrical machines — Part 2-1: Standard methods for determining losses and efficiency from tests. International Electrotechnical Commission.
- IEC. (2024). IEC 60034-2-3:2024 — Rotating electrical machines — Part 2-3: Specific test methods for determining losses and efficiency of converter-fed AC motors (2nd ed.). International Electrotechnical Commission.
- IEC. (2014). IEC 60034-30-1:2014 — Rotating electrical machines — Part 30-1: Efficiency classes of line operated AC motors (IE code). International Electrotechnical Commission.
- IEC. (2025). IEC 60034-30-1:2025 — Rotating electrical machines — Part 30-1: Efficiency classes of line operated AC motors (IE code) (2nd ed.). International Electrotechnical Commission.
- IEC. (2016). IEC TS 60034-30-2:2016 — Rotating electrical machines — Part 30-2: Efficiency classes of variable speed AC motors (IE code). International Electrotechnical Commission.
- IEC. (2025). IEC 61800-9-2:2023+AMD1:2025 — Adjustable speed electrical power drive systems — Part 9-2: Ecodesign for motor systems — Energy efficiency determination and classification (2.1 ed.). International Electrotechnical Commission.
- European Commission. (2019). Commission Regulation (EU) 2019/1781 laying down ecodesign requirements for electric motors and variable speed drives. Official Journal of the European Union, L 272.
- U.S. Department of Energy. (n.d.). Motor Systems. Advanced Manufacturing Office, Office of Energy Efficiency and Renewable Energy.
- Ishak, D., Zhu, Z. Q., & Howe, D. (2005). Eddy-current loss in the rotor magnets of permanent-magnet brushless machines having a fractional number of slots per pole. IEEE Transactions on Magnetics, 41(9), 2462–2469.
- Ragazzo, P., Dilevrano, G., Bojoi, A., Ferrari, S., & Pellegrino, G. (2024). Fast efficiency mapping procedure for PMSM accounting for the PWM supply impact. 2024 IEEE International Conference on Industrial Technology (ICIT), 1–6.
- Li, Z., Liu, B., Fransson, P., & Peretti, L. (2024). Equivalent resistance model of the permanent-magnet motor for predicting electromagnetic losses. 2024 International Conference on Electrical Machines (ICEM).
- Chebabhi, L., Naas, T. T., & Zitouni, M. (2025). Modelling and analysis of brushless permanent magnet motor based on loss maps. Algerian Journal of Signals and Systems.
FAQ
Q: What is the efficiency of a BLDC motor?
A well-designed BLDC motor may reach 85–95% efficiency from motor terminals to shaft at rated load with the winding near ambient temperature. Including the controller typically gives 80–91% system efficiency. Motors under 100 W often fall in the 70–85% range because bearing friction and windage account for a larger share of their power. State the load point, measurement boundary, and winding temperature with any quoted figure.
Q: Are BLDC motors more efficient than brushed DC motors?
Yes. At rated load, the motor-only efficiency difference is typically 3 to 7 percentage points. At system level, the difference is a little over 4 points when each controller is included. Brushless motors also avoid brush wear, reducing a maintenance requirement rather than energy use.
Q: Why is my BLDC motor less efficient than its datasheet claims?
Common causes include operation below 50% rated torque, where efficiency may fall by 5 to 8 points; a hot winding, which costs about 2 points from copper resistance alone and up to 3.7 points when magnet drift is included; controller losses that are inside your measurement but outside the datasheet boundary; or a modelled stray-loss value instead of a measured one, which can shift efficiency by up to 1.5 points.
Q: At what load is a BLDC motor most efficient?
Peak efficiency often occurs between 70% and 85% of rated torque, rather than at 100%. Copper loss rises roughly with load squared, while iron loss changes little with load. In the 400 W example, efficiency at 75% load (88.1%) is slightly above the rated-load value (88.0%); both exceed the quarter-load value of 80.5%.
Q: Can a BLDC motor carry an IE4 efficiency class?
No, not formally. IEC 60034-30-1 covers line-operated single-speed machines and excludes motors that are not rated for direct-on-line sinusoidal operation, so a converter-fed BLDC falls outside its scope regardless of how efficient it is. Variable-speed machines are addressed by IEC TS 60034-30-2, which is written around sinusoidal fundamental current, and drive systems by IEC 61800-9-2. Any “IE4 equivalent” claim on a brushless datasheet is informal.
Q: How much energy does one percentage point of efficiency save?
At 400 W output and 2,000 operating hours a year, one point is about 10.5 kWh per year at the rated point: 400/0.87 minus 400/0.88 gives 5.2 W of extra input power, multiplied by 2,000 hours. The saving scales with power and hours, not with the label. If the duty cycle spends most of its time at a quarter load, the rated-point improvement may never be realised, which is why duty-cycle weighting matters more than the headline figure.